AI agents fail in ways traditional software does not: silently, plausibly, and at a price per failure. The only honest response is to record everything — and Botlit does, at the level of the individual run.
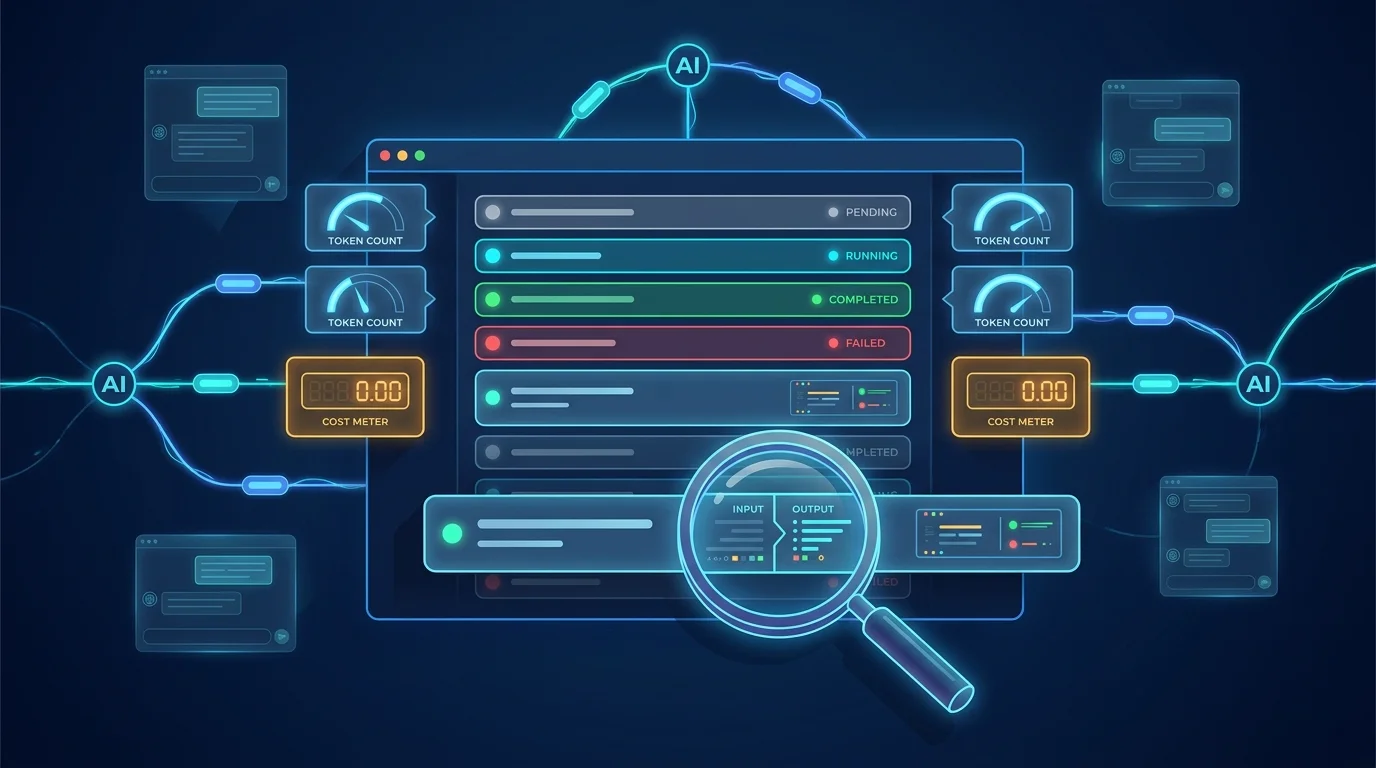
Every execution has a lifecycle: pending, running, then completed, failed, cancelled, or timed out. Each record carries the input that went in, the output that came back, and metrics — total, input, and output token counts, cost, tool calls, and retrieved chunks. Nothing about "what did the agent do" is a matter of opinion.
Debugging starts from the record. A user reports a strange answer; you open the execution, see the exact input, the model that ran, and the full output. A spike in spend appears; you sort executions by cost and find the runaway prompt in minutes. Because the execution links back to the agent version, "which release caused this" is read off the record, not bisected from memory.
Per-agent statistics aggregate the same data upward, and the Botlit dashboard surfaces it across the workspace — which agents are busy, what they are consuming, how runs are trending. Real-time execution updates are exposed as a subscription for teams building their own monitoring on top.
The deeper point is that the audit row is written by the same code path that runs the agent — the chat mutation resolves credentials, calls the model, and records the execution as one act. There is no instrumentation to forget and no sampling: if it ran, it is in the ledger.
Illustrative route map only — it is not evidence that this use case has been executed or verified in production.
Illustrative route map
Run agents with a complete audit ledger: every run is an execution record you can list, filter, and open down to its tokens, cost, and the exact model that ran — with a dashboard view across the workspace.
- 1
Open the Botlit dashboard to see activity across your workspace.
You should see: The dashboard surfaces which agents are busy and how runs are trending.
- 2
- 3
- 4
- 5
- 6
Ready to make this your story?