Execution Ledger and Run Costs
Every agent, channel and workflow run recorded with its status, duration, tokens, cost and the model that produced it.
These images are illustrations of the concept, not screenshots of the actual product.
Overview
The execution ledger is the Botlit concept for a single, searchable record of everything the agents in a workspace have done. The illustration shows an Executions page whose subtitle states the scope plainly: every agent, app and workflow run. Four summary tiles across the top carry the totals for the selected window, covering run count, tokens consumed, spend and a ninety-fifth percentile latency figure, so the health of the fleet reads at a glance before anyone opens a row.
The problem is that agent work is invisible by default. A reply appears in a channel, a workflow finishes, a delegated task completes, and none of it leaves a trace a finance or operations team can inspect. Without one, a failure is noticed only when someone complains, and a cost increase is noticed only on an invoice. The design answers that with a ledger rather than a dashboard: status filters for completed, failed, timed-out, cancelled and running work sit beside a time-range control, a search field in the top bar narrows the view to one agent, and the table underneath lists each run with its identifier, the kind of run, the agent or bot responsible, a status badge, duration, token count, cost, the model used and the start time. The sample rows span a chat turn, a channel message, a workflow and a delegated agent-to-agent run, including one failed run that consumed no tokens and cost nothing.
In the design, the selected run opens a detail rail on the right. It repeats the run identifier and status, restates duration, tokens and cost as tiles, then breaks the run down further into input and output tokens, tool calls and the number of retrieved chunks that were injected. A model section names the model, its provider and a note that it runs on a workspace key, and collapsible input and output sections show the question that started the run and the beginning of the answer it produced.
The concept ties the rest of the product together. The run identifier shown here is the same one that appears on a tool loop, the retrieved-chunk count matches what a grounded chat reply reported, and token counts are the unit a daily token budget policy measures against. Failure rates, cost per run and retrieval results of this kind are also the evidence the operations findings concept cites when it flags a regression.
What this concept shows
- Summary tiles for run count, tokens, spend and a ninety-fifth percentile latency over the selected window
- Status filters for completed, failed, timed-out, cancelled and running work
- A time-range control and a search field for narrowing the ledger to one agent or period
- A run table with identifier, run type, agent, status, duration, tokens, cost, model and start time
- Run types spanning chat, channel, workflow and delegated agent-to-agent work
- A failed run recorded with zero tokens and zero cost rather than hidden
- A detail rail breaking a run into input and output tokens, tool calls and retrieved chunks
- Collapsible input and output sections showing the question asked and the answer produced
How it works
- Open the Executions section and read the summary tiles for the current window.
- Narrow the ledger with a status filter, a time range, or a search for a particular agent.
- Scan the table for runs that failed, ran long or cost more than their peers.
- Select a run to open its detail rail with duration, tokens and cost restated as tiles.
- Read the token breakdown, tool-call count and retrieved-chunk count to see where the run spent its budget.
- Expand the input and output sections to compare the question asked with the answer produced.
Who it's for
- Operations leads tracking agent reliability
- Finance and budget owners watching model spend
- Support managers investigating a specific conversation
- Workspace admins auditing what agents did and when
Illustrations
1 illustration of this concept. Select one to view it full size.
Execution ledger with run totals and a run detail rail
This desktop illustration shows an executions page whose subtitle describes it as covering every agent, app and workflow run. Four tiles across the top give run count, total tokens, total spend and a ninety-fifth percentile latency for the window. A row of status filters for all, completed, failed, timed-out, cancelled and running work sits beside a time-range control set to the last day, with the completed filter highlighted and an agent name already entered in the search field. The table lists five sample runs with columns for run identifier, type, agent, status, duration, tokens, cost, model and start time, spanning chat, channel, workflow and agent-to-agent runs, one marked failed with zero tokens and zero cost. The selected run opens a detail rail repeating its identifier and completed status, three tiles for duration, tokens and cost, a breakdown of input and output tokens, tool calls and retrieved chunks, the model with its provider and a workspace-key note, and collapsible input and output sections.
Topics
- AI execution log
- agent run history
- LLM token and cost tracking
- AI observability
- per run cost visibility
- failed agent run debugging
- p95 latency agents
- audit trail for AI agents
- chatbot analytics
- model spend monitoring
Related concepts
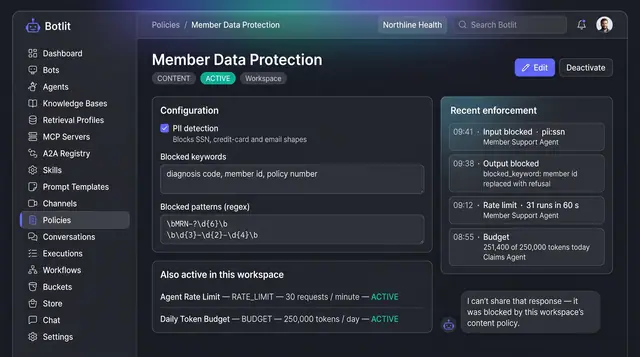
Content Policies and Guardrails
Workspace policies that block unsafe input and output, cap request rate and token spend, and list recent enforcement events.
1 illustration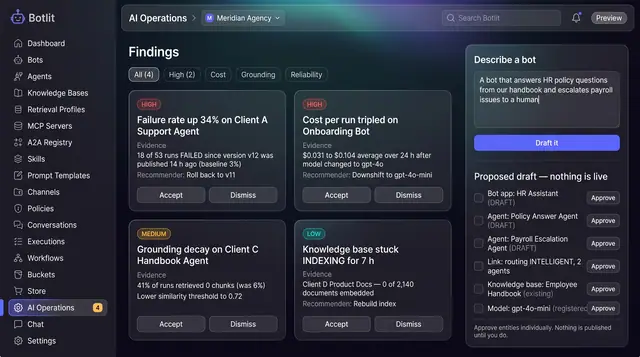
AI Operations Findings and Bot Drafting
An operations copilot that flags regressions across your bots and drafts a new one from a plain-language description.
1 illustration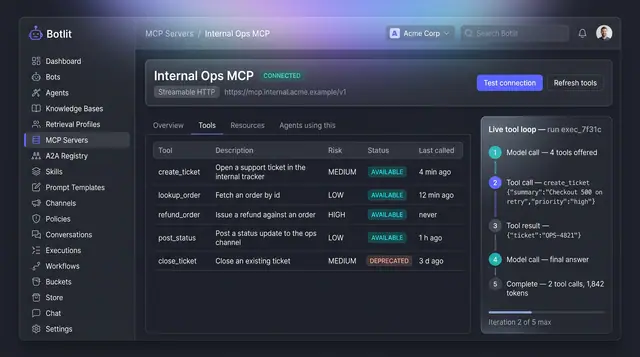
MCP Tool Servers and Live Tool Loop
A connected tool server lists every tool it exposes with a risk level, beside a step-by-step trace of one agent's tool calls.
1 illustration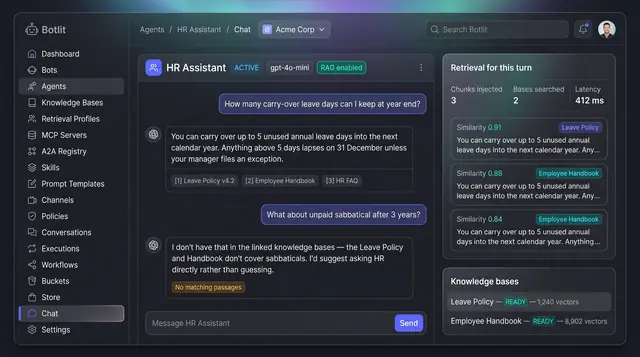
Grounded Answers with Cited Sources
Agents answer from your own knowledge bases, show the passages they used, and say so plainly when nothing matches.
1 illustration