MCP Tool Servers and Live Tool Loop
A connected tool server lists every tool it exposes with a risk level, beside a step-by-step trace of one agent's tool calls.
These images are illustrations of the concept, not screenshots of the actual product.
Overview
This Botlit concept is about giving an agent real actions instead of only words, and keeping those actions visible. The illustration shows a registered Model Context Protocol server inside the workspace, opened from the MCP Servers section, with a connected status, a transport tag reading streamable HTTP, the server endpoint address and controls to test the connection or refresh the tool list.
The problem is that a tool-using agent is easy to build and hard to supervise. Once an agent can open tickets or issue refunds, someone has to know which actions exist, how dangerous each one is, whether it still works, and what the agent actually did on a given run. The design puts all four in one place. A tools table lists each discovered tool with a plain-language description, a risk level, a status and the time it was last called. In the sample data a lookup tool and a status-posting tool sit at low risk, ticket creation at medium, and a refund tool at high risk that has never been called, while one retired tool is still listed but flagged as deprecated. Tabs for an overview, resources and the agents using the server round out the record.
Beside the table, a live tool loop panel follows a single agent run as a numbered sequence: a model call that offered four tools, a ticket-creation tool call with its arguments shown as a small structured payload, the ticket reference returned, a second model call that produced the final answer, and a completion step summarizing how many tool calls were made and how many tokens the run consumed. A progress indicator underneath reports which iteration the loop is on and the maximum it is allowed, so a runaway loop is bounded rather than open-ended.
The concept connects outward to the rest of the workspace. The run identifier on the loop panel matches a chat run in the execution ledger concept, where the same run is recorded with two tool calls and the same token total, and the tab for agents using this server is designed to tie it back to the agents that depend on it. The MCP Servers entry sits in the same left navigation as Agents, Bots, Policies and Executions.
What this concept shows
- A registered tool server with a connected status, a transport tag and a server endpoint
- Controls to test the connection and refresh the discovered tool list
- A tools table with a description, risk level, status and last-called time for every tool
- Risk levels spanning low, medium and high, including a high-risk refund action never yet called
- A deprecated tool still listed rather than silently dropped
- A live tool loop showing model calls, the tool call with its arguments, and the returned result
- A completion step summarizing tool calls and tokens for the run
- An iteration counter with a maximum, bounding how long the loop may run
How it works
- Open a registered tool server from the MCP Servers section and confirm it reports a connected status.
- Use the test-connection and refresh controls to check the server and pull its current tool list.
- Review the tools table to see each tool's description, risk level, status and when it was last called.
- Note which tools carry high risk or a deprecated status, such as a refund tool that has never been called and a retired ticket-closing tool.
- Check the tab listing the agents using this server to see who depends on it.
- Follow the live tool loop for a run to read each model call, tool call, result and the closing summary.
- Watch the iteration counter to confirm the loop stays inside its allowed maximum.
Who it's for
- Automation engineers connecting agents to internal systems
- Platform admins who approve which tools agents may call
- Support operations leads tracing what an agent did on a run
- Security reviewers assessing the blast radius of agent actions
Illustrations
1 illustration of this concept. Select one to view it full size.
Tool server detail with a live tool-call loop
This desktop illustration shows a registered tool server in the MCP Servers section, with a connected badge, a streamable HTTP transport tag, the endpoint address, and buttons to test the connection and refresh the tool list. Tabs cover an overview, tools, resources and agents using the server, with tools selected. The table lists five sample tools with columns for name, description, risk level, status and last call: a low-risk lookup and status-posting pair, a medium-risk ticket creation tool, a high-risk refund tool never yet called, and a medium-risk tool marked deprecated while the other four show as available. On the right, a numbered live tool loop panel headed by a run identifier shows a model call offering four tools, a ticket-creation tool call with its arguments as a small structured payload, the ticket reference returned, a second model call producing the final answer, and a completion line with tool-call and token counts, above an iteration progress bar and its maximum.
Topics
- MCP server integration
- model context protocol tools
- agent tool calling
- tool risk levels
- tool call trace
- AI agent actions
- deprecated tool handling
- tool loop iteration limit
- connect agents to internal systems
- agent automation tools
Related concepts
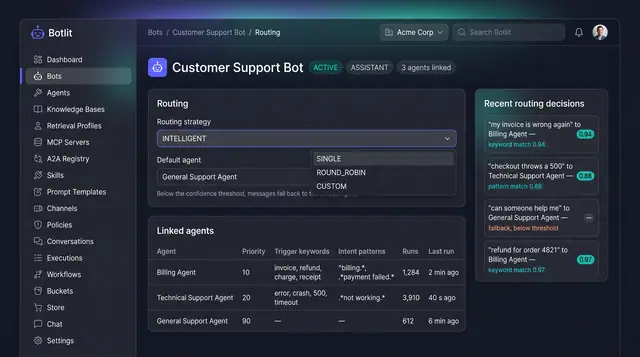
Intelligent Routing and Agent Delegation
A bot sends each message to the right specialist agent, and agents hand work to one another inside trust and depth limits.
2 illustrations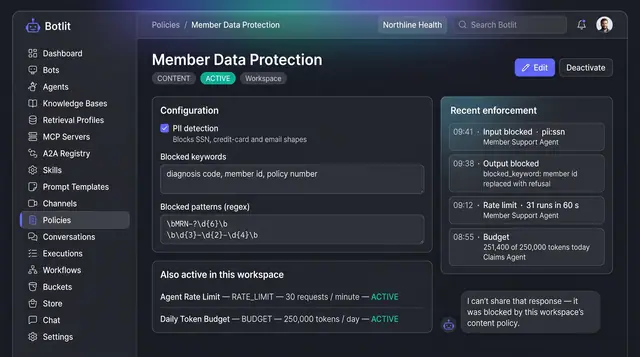
Content Policies and Guardrails
Workspace policies that block unsafe input and output, cap request rate and token spend, and list recent enforcement events.
1 illustration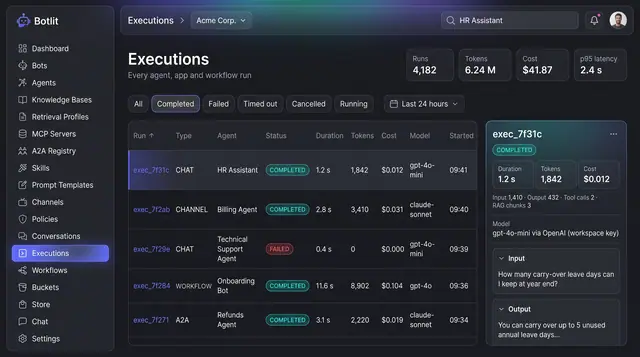
Execution Ledger and Run Costs
Every agent, channel and workflow run recorded with its status, duration, tokens, cost and the model that produced it.
1 illustration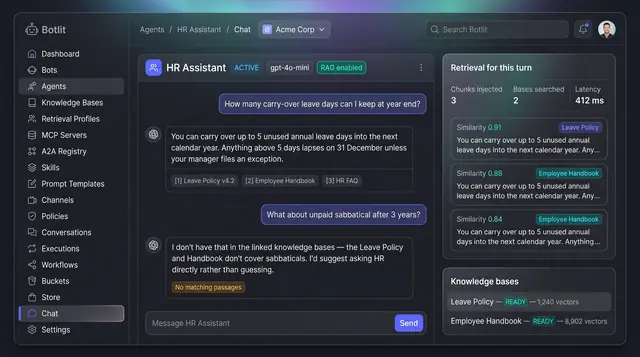
Grounded Answers with Cited Sources
Agents answer from your own knowledge bases, show the passages they used, and say so plainly when nothing matches.
1 illustration